#29 River Flooding
River flooding happens when heavy rain causes river levels to rise and overflow with large amounts of water. In recent years in Japan, a weather phenomenon known as "linear rainbands" has led to frequent torrential rain and the flooding of rivers. River flooding comes in two forms, and when one accompanies the other, the damage also grows more intense. Knowing the risks in the areas we call home and swiftly fleeing to a safe evacuation site in times of emergency are what is most needed to save lives. We will introduce tools with the latest digital technology that are effective for this purpose.


Transcript
Japan has a long history of natural disaster.
Now, the power of science is helping to overcome them.
BOSAI.
Science that can save your life.
Disasters caused by torrential rain occur almost yearly in Japan.
The 2018 torrential rain in western Japan claimed over 200 lives
as a result of the widespread flooding of homes and related incidents.
The Kuma River, which flows through southern Kumamoto Prefecture,
flooded extensively from heavy rainfall in 2020, killing over 80 people.
The main reason for the growing severity of such damage is river flooding.
This occurs when heavy rain causes river levels to rise and overflow with massive amounts of water.
Japan has high rainfall, and every year somewhere in the country typhoons and torrential rains
cause river flooding, often resulting in loss of life.
Why is the damage becoming greater?
We will take a look at the mechanisms of river flooding and the frontline of preventive measures.
One major factor contributing to the severity of the heavy-rain disasters in recent years
is the forming of linear rainbands.
This weather phenomenon occurs when cumulonimbus clouds continue to accumulate,
causing heavy rainfall to persist in the same area for an extended period.
Damage from the Kuma River flooding in 2020 was also worsened due to a linear rainband.
Shouji FUKUOKA studies hazards associated with Kuma River flooding,
and he says that river flooding essentially takes two forms.
Heavy rainfall can fill rivers until they overflow and flood.
This is called "external flooding."
The other form is "internal flooding."
External flooding is when land and buildings are inundated after torrential rain causes river levels to rise
and river water to go over embankments and breach levees.
This form is characterized by large-scale flood damage resulting from huge amounts of water
rapidly overflowing from rivers and into residential areas.
In contrast, internal flooding is when buildings and roads are inundated from sewers
not draining enough rainwater.
This form is distinct in that it occurs even in places far away from large rivers.
Internal flooding has become more frequent in recent years and is mainly seen in urban areas.
Damage from the Kuma River flooding was especially severe in Hitoyoshi City.
Many people fell victim there as it's a basin closed in by the main stream of the Kuma River
and the Yamada River and Mae River tributaries.
The rivers flooded due to the torrential downpour occurring from July 3 into July 4, 2020.
What was the damage like in Hitoyoshi City?
It rained very heavily
throughout the entire Kuma River valley.
At that time, a linear rainband had formed in the sky above Hitoyoshi City,
and heavy rain continued to pour down without letting up.
This graph shows the rainfall at the time in Hitoyoshi City.
We can see that it kept raining at levels exceeding the 30 millimeters of hourly rainfalls
set as the guideline for a heavy rain advisory.
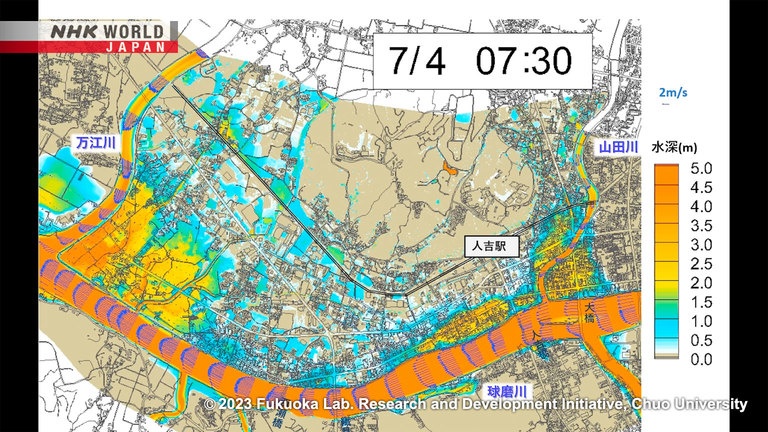
This simulation created by Shouji Fukuoka is of the flooding in Hitoyoshi City.
From daybreak on July 4, the sections colored in orange continued to grow.
The orange indicates a water depth of 5 meters or higher,
meaning that the homes were submerged up to their second floors.
This visualization shows the relationship between the water depth and fatalities.
The white marks show the locations where the victims were found.
Most of them perished in spots where the water was over 3 meters deep.
The direct cause of the fatalities was mainly the external flooding.
On July 4, external flooding occurred along the Yamada River at about 5:30 a.m.,
then along the Kuma River from about 6:00 a.m., and along the Mae River at about 6:30 a.m.
Could these residents have evacuated to higher ground?
With this disaster, there had been internal flooding
from about 10 p.m. on July 3.
There had already been flooding within Hitoyoshi City about 8 hours before the external flooding started.
Let's rewind and watch the flood simulation again.
After 10 p.m. on July 3, internal flooding arises throughout the town.
The water filled the streets and waterways relentlessly,
flooding the entire town by morning.
At around 5:30 a.m., most of the town was inundated with about 1 meter of water.
And this was due to internal flooding.
I think many residents may have lost their chance
to evacuate because of the internal flooding.
Professor Fukuoka believes that the damage to Hitoyoshi City was worsened
by the internal flooding taking place before the onslaught of external flooding.
The destruction within Hitoyoshi City didn't end there.
There was loss of life even in places where the water was comparatively shallow.
One such victim was a man riding a motorbike.
He was knocked down and taken by the current at this intersection at about 7:30 a.m. on July 4.
His body was then found on a later date.
This simulates the speed of the current at the same location.
As of 7:30 a.m., the area around the intersection had turned yellow and the current had gained speed.
The current speed was over 2 meters per second, and the water was about 1 meter deep.
These tests presume a person is walking through flood water.
The vertical axis is the water depth, and the horizontal axis is the current speed.
It's difficult to evacuate above the red line but possible below the red line.
For example, it's challenging for an adult male to walk in water 0.4 meters deep
with a current of 1 meter per second.
At the intersection where the man was carried away,
the water was 1 meter deep and the current was 2 meters per second.
What was causing the current at the intersection?
The current gained speed due to the streets being sloped.
There's a decline of about 3 meters from the Kuma River to the intersection.
And then there's a further descent of about 2.5 meters to where his body was found.
This minor downward slope likely created a strong current and carried the man away.
It's important to be aware of what makes the places
we live distinct with regard to flooding.
I'd like everyone to routinely look into
how water would flow and where it would be dangerous.
In fact, the number of people living in places at risk of flooding is increasing.
A major cause is that apartment buildings are being constructed
and farmland is being developed for housing on land with a high flood risk.
According to the 2015 census, about 47 million people live in places at risk of flooding.
That's nearly 40 percent of the national population.
And in the 20 years from 1995 to 2015,
this number has increased by about 1.77 million people.
As the inundation becomes more severe and frequent,
the government is developing advanced tools for quicker and more accurate evacuation.
The key is a new disaster management platform that utilizes digital transformation.
The government is currently promoting a project
that recreates realistic city models on computers with 3D computer graphics.
Its name is PLATEAU.
UCHIYAMA Yuya from the Ministry of Land, Infrastructure, Transport and Tourism explains.
PLATEAU is a project that digitalizes data on real city spaces and
performs various simulations and analyses in cyberspace.
It's then reflected in actual policymaking.
They've digitalized all kinds of data managed by municipalities, ranging from data on city measurements,
such data on land and building usage as building height, purpose, and year constructed
to population statistics and disaster prevention information.
They then reproduced it as 3D city models in cyberspace.
Conventional 3D maps were simply converted into 3D from 2D maps,
making the size of buildings inaccurate.
However, the 3D city models are accurate to scale
since they've been created based on the actual measurement data of cities.
What's more, these innovative 3D maps incorporate detailed information
not seen on conventional maps for each building.
They've put in building names, accurate heights, stories above and below ground,
years constructed, purposes, and structural types.
So, by utilizing these 3D city models, they're able to readily create the ultra-high precision disaster simulations
that had been hard to implement until now.
How can PLATEAU be utilized for disaster prevention?
Its use for disaster prevention is
where PLATEAU has made the most progress.
This is a conventional hazard map provided by municipalities.
It shows the risk in the event of a flood by color-coding the water depth and range of inundation.
This is a 3D hazard map of Tokyo utilizing PLATEAU.
It has simulated a flood of the Arakawa River valley
presuming the type of torrential rain that flooded the Kuma River.
The depth and range of the inundation are easy to see.
For example, this is the view out of Kitasenju Station's West Gate.
The lower half of the escalators in front of the station is submerged,
but the pedestrian walkway linking the buildings has escaped flooding.
Meanwhile, the housing in this residential area along the Arakawa River
is mostly submerged up to the second floor with the roofs barely visible.
We can see right away which places in the city have a high flood risk.
DEGUCHI Keisuke is from the Arakawa-Karyu River Office,
the developers of this 3D hazard map.
We feel 3D has greater appeal since more information
can be taken in visually than with 2D.
We believe it's a powerful tool in helping residents
to understand flood risk and be ready to evacuate.
For Mr. Deguchi, one key point is how these maps accurately visualize
which buildings permit vertical evacuation.
Vertical evacuation means immediately evacuating to a higher level in the event of a flood.
This green building on the right supports vertical evacuation,
while the brown building on the left does not.
For example, this building is tall enough to avoid flooding
yet doesn't allow for vertical evacuation.
Evacuating to a higher level isn't an option since it's a warehouse without a second floor.
PLATEAU makes it possible to have realistic simulations
by integrating 3D maps with building data.
Our goal is to continue the nationwide expansion
of these 3D hazard maps
and disaster-prevention drills that utilize VR and AR.
There are currently 3D models for about 100 cities,
and they hope to have them for 500 cities by 2027
as they proceed to make the country resilient to disaster.
It is vital to understand the risk of your living area accurately
and evacuate to a safer place at an early stage.
I also feel the necessity of being prepared for inundation
by utilizing new digital technology such as 3D maps.