Meteorological Data
*First broadcast on June 22, 2023.
In Japan, businesses are linking meteorological data and sales figures in order to predict consumer demand. This is helping to reduce waste and lower carbon dioxide emissions through optimization of distribution networks. One popular app charts the relationship between the weather and headaches or feeling "under the weather" in other ways. We explore how meteorological data is contributing to everyday life in Japan these days.
Transcript
Hello, and welcome to Japanology Plus.
I'm Peter Barakan.
From Hokkaido in the north
to Okinawa in the south,
Japan has a range of different climates,
each with its own weather patterns.
There's a rainy season in the summer,
there's a typhoon season...
these are all things
that people are used to.
But global warming
in recent years has made
the weather increasingly unpredictable.
This plays havoc with agriculture.
Not only that,
but many businesses are also affected.
There's also a movement now in Japan
to use meteorological data
to mitigate the effects of climate change.
And that's our theme
for the program today.
- Nice to meet you.
- Nice to meet you. Hello.
Looking forward to it.
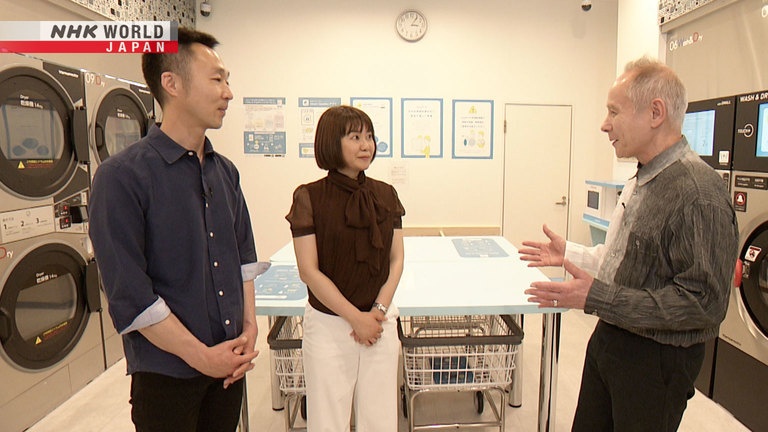
Married couple Kato Fumiyo and Yoshiki
are weather data analysts.
They use data analysis and AI
to solve problems for
businesses affected by the weather.
I gather that your official description
is “weather data analyst.”
What kind of data do you analyze,
and in what way?
Weather makes a significant impact
on what people do.
If it's raining, we might stay in,
or buy an umbrella,
or buy waterproof shoes.
It exerts a major influence on society.
We take behavioral data and weather data,
and analyze their relationship.
This makes it possible to predict
consumer demand, and prepare accordingly.
Can you give us some specifics?
Well, renewable energy is very much
a focus of attention these days.
Wind and solar power
generation methods, for example,
are greatly affected
by weather conditions.
By using meteorological data,
you can estimate how much power
will be generated in the days ahead.
It's the same for energy consumption.
Weather affects whether people switch
on lights, or use an air conditioner.
It has a clear effect on demand.
Using weather data to forecast
both power generation and demand
makes it possible
to establish a reliable supply of energy,
while also reducing waste.
Let's see how a system developed
by the Katos is actually used.
Laundromat.
So is there something special
about this place?
At this laundromat chain,
you can interact with
the machines using your smartphone.
For example, take this washing machine.
Once you've put in your laundry,
you can scan the code
and complete the payment on your phone.
When the machine has finished,
it sends you a notification,
so you know it's time
to pick up your clean laundry.
OK. And the two of you are involved
in this in what way?
We developed a system
that can predict demand
by analyzing both meteorological data
and also usage data
from the laundromat's machines.
Hello.
Hello.
Kato-san is in charge of technological
development for this business.
So how effective was their system?
Well, we were already aware
that our type of business
was strongly affected by the weather.
But then we asked the Katos
to investigate the relationship
between laundromats and the weather,
and present that information
to us in the form of concrete data.
They made the extent
of that relationship clear.
And in fact it turned out to be a much
stronger connection than we had imagined.
Here's what the system looks like.
It shows a list of dates,
and a forecast of what the
weather will be like on each day.
OK.
These numbers—five, three, two,
and so on—
represent estimated demand.
Five is highest.
Smaller numbers mean
that we expect lower demand.
OK.
Here's the easiest point to grasp.
There's a number two here, right?
It comes during a sunny spell.
If there's a run of sunny weekdays,
the demand for laundromats goes down.
So on this Wednesday and Thursday,
predicted demand is at level two.
The demand estimates we receive via this
system are around 70 percent accurate.
So we have a lot of confidence in them.
The company used the data to
implement a new dynamic pricing system.
The upper chart shows prices
for peak times.
A single laundry cycle during the daytime
costs 2,100 yen.
The lower chart shows prices
for off-peak times.
The same service costs 1,900 yen.
Customers can access these prices
in advance, using an app.
Weekends and rainy days are usually busy.
Dynamic pricing is helping
to even things out,
encouraging more customers to visit
at times that would otherwise be quiet.
Our sales figures have risen
by around 10 to 15 percent.
We've also seen a change
in customer behavior.
People are visiting at times
that previously would have been quiet.
More and more customers are doing that.
So to create this system, you have
to have a lot of data at your fingertips.
Where are you getting the data from?
The Japan Meteorological Agency.
Oh, OK.
The Agency is located in Tokyo.
This government facility
collects meteorological data
from across the country,
and its weather forecasts
are always up to date.
Additionally, it gathers data
on potential natural disasters,
and, when necessary,
issues warnings about them.
The Agency operates around the clock,
all year round.
Hello.
Hello.
Hello.
So this is where it all happens.
When we see the news on TV,
all of the information's coming from here?
Yes.
This is the main operation room.
We get information
from weather satellites, from radar,
and from around 1,300 data-measuring
points all around the country.
In addition to data about Japan,
information is constantly coming
in from abroad, as well.
Are there any particular factors
that affect the weather
and the way it changes in Japan?
Japan is located to the east
of a huge continental landmass.
That's a major factor.
The prevailing winds
are basically westerly.
That makes a big impact on the weather.
It's crucial to have data
about China and the Korean peninsula,
regions that are west of us.
And also southeast Asia.
Private businesses use data
from the Japan Meteorological Agency
to offer an increasingly
wide range of services.
The concept was pioneered by a company
founded in 1950, in Ikebukuro, Tokyo.
Here they analyze meteorological data,
sales records and other information
in order to forecast demand
for seasonal products.
In Gunma Prefecture,
a major tofu maker used this information
to significantly reduce waste.
In 2017, around 1.8 million packs
of tofu were produced per day.
Overproduction was a major issue.
Annual food losses added up
to around 10 million yen.
At the time,
production levels were based
on the simple idea that
sales are better on hot days.
It was all intuition.
We knew that weather
changes were important,
but we had no way
to access accurate guidance.
To address the problem, the CEO contacted
the weather data company.
They analyzed the relationship
between the past year's sales
and the perceived temperature,
then listed expected demand
as a number from zero to 100,
where 100 represented
the previous year's top sales for one day.
The forecast for this day was sunny,
with a high of 25 degrees Celsius.
The previous day, at 22 degrees,
was expected
to feel relatively cool because of rain.
The sunny day after it would
then feel even hotter than 25 degrees.
For that reason,
the expected demand was set at 76—
in other words, 76 percent of the top
daily amount in the previous year.
Our perception of temperature may
not match objective reality.
If it suddenly feels hotter,
people notice it—and they buy more tofu.
The system successfully
reduced overproduction.
Food loss was reduced by 30 percent,
and now only 0.06 percent
of the tofu produced has to be discarded.
It's interesting that you can
use weather data to reduce food loss.
People have long been aware
of the weather's effect
on sales of various products.
That understanding has
been there for years.
But recently, by quantifying
and analyzing the situation,
we've understood the percentages—
we can calculate the reduction
in food loss,
and represent it numerically.
We've entered an era
when various organizations can move beyond
simply looking at a weather forecast—
instead,
they can make direct use of weather data.
That's where we are now.
So to be specific,
I mean, for example
if loss is being reduced by that much,
presumably there'll
be less trucks delivering food.
Are we talking about things like that?
It certainly is important to look
at that side of things.
We shouldn't focus solely on
whether a product sells, or doesn't sell.
We should look at reducing waste.
And what that implies is that
we should be minimizing
the amount of materials
that are used in the first place.
It's about improving
the entire logistics process.
Optimizing the process.
Our goal is to address every aspect of
what people refer to as the supply chain.
That's what we want to optimize.
And using weather data,
you can change that?
Well, we can forecast the weather
two weeks in advance
with a high degree of accuracy.
And for example,
if we know it's going to get very hot
in a specific region next week,
we can estimate that the sales
of cold drinks there will go up.
That's a pretty safe prediction to make.
It's obvious to anyone.
Therefore,
you might decide to
transport the drinks by sea,
rather than by land.
Transporting things by sea is slower,
but it generates much
less carbon dioxide.
But we're not just analyzing
atmospheric conditions —
what's going on in the sky.
We're looking at the
height of the ocean swell,
the movements of the tide,
the speed of currents.
We estimate all of those factors.
As far as possible,
we want to see cargo ships traveling
with a following wind.
And they'll want
to be moving through calm waters.
That helps to reduce
emissions even further.
Production...distribution...
retail sales...
everything can
be optimized using weather data.
And that leads to positive outcomes
for everybody.
OK, wow. I wouldn't
have imagined it going that far.
So depending on how you use the data,
not only can you reduce loss,
but you can actually also reduce
the emissions of carbon dioxide.
So potentially this has a lot
of positive effect.
Welcome to Plus One. I'm Kyle Card.
Now, weather patterns in Japan
can be a little difficult to navigate.
For example,
there are extended periods of rainfall
in the spring and autumn.
And the summer...
it is sweltering and super humid.
But to make life
during those periods
a little bit more
bearable and comfortable,
some wonderful and unique goods
and services have been created.
And today I'm going
to share some of them with you.
Let's go check them out.
First up, for rainy days and rainy periods
there's a special contraption I'd like
to introduce that you can often see
placed in front of many Japanese shops
and department stores alike.
Ta-da!
Now, what do you think it is?
Here's a hint. I have an umbrella.
Haha!
Now, today is a beautiful day,
but let's say it was raining,
and this umbrella was soaked.
If we go into the establishment like this,
it could get the floor wet,
people could slip,
you can get your clothes wet,
other people wet, it could be a disaster.
But if we use this contraption...
take a look at that.
Your soaked umbrella is placed inside
this plastic bag sheath,
and you and everything
around you is kept bone dry.
Now isn't that convenient?
Now you won't just find
these contraptions located in Japan.
Recently you can find them in Europe,
in front of museums, in art galleries,
and the consensus is
they're unique and super useful.
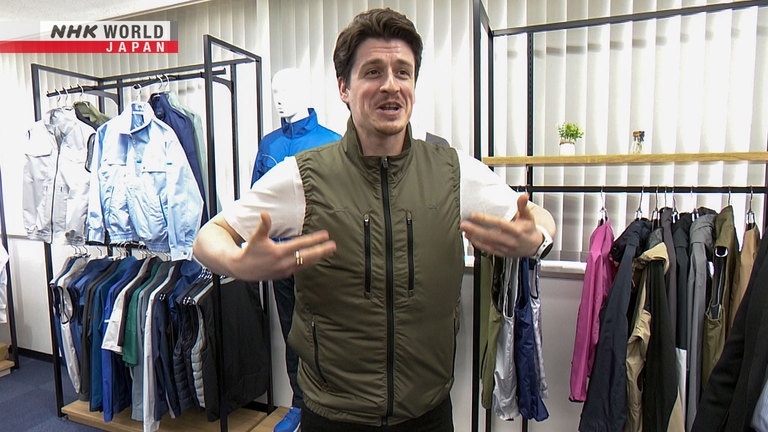
Next we have some items
that can help keep you cool
during the hot and humid Japanese summers.
Looks like clothing.
Hello.
I heard that you have
some special items here
that can help keep you cool
and make life a little more comfortable
during the Japanese humid summers.
That's right. Air-conditioned clothing.
Air-conditioned clothing?
What do you mean by that?
Well...it's equipped with fans.
Ah!
They suck in a large
quantity of outside air.
And that air flows across the body.
It evaporates sweat,
and then the air is pushed outside again.
OK.
Let's turn it on.
Air conditioners and refrigerators
use a similar basic principle.
One key point is to transform a liquid.
Humans don't have a natural way
to move air in order to evaporate sweat.
That's what these fans do.
That's so interesting.
Why don't you try this on?
Oh, may I? I'd love to.
Ohh!
That's great!
Wow, I want this.
The air's just coming up from the bottom,
coming out through my neck,
through my arm holes here.
I can feel my sweat drying and being shot
out the holes here.
This is great.
I need this for summer. Wow.
And there you have it.
Today we've introduced
some wonderful goods and services
that can help ease
your meteorological woes.
I, for one, might be picking up some
air-conditioned clothing
because Japanese summers are my nemesis.
But whether you're trying
to keep dry or keep cool,
Japan has some wonderful innovations
that are truly thoughtful.
Now let's see an application of weather
data that improves quality of life.
Nice to meet you.
Thank you for letting us come here.
I hear you have a service
that uses weather data,
and I'm hoping you can tell us
something about it.
The service is an app designed
to combat “kisho-byo,”
or weather-related illnesses.
It shows expected changes
in atmospheric pressure,
and identifies days when headaches,
mood changes or other conditions
are more likely.
It has been downloaded
over 10 million times.
Kisho-byo. So that means, kind of,
“weather-related illness.”
I don't think I've heard
that expression in English,
but I know that when the weather gets bad,
sometimes when the air pressure
gets really low,
you can feel not so great.
So is that what we're talking about?
Some people don't feel
so good on cloudy mornings.
Their mood drops.
Others get headaches when typhoons
or other rain clouds are approaching.
When the weather has
that kind of negative effect,
we call it a “weather-related illness.”
Changes in atmospheric pressure
can affect the inner ear.
In some people,
this disrupts
the autonomic nervous system,
resulting in headaches or other ailments.
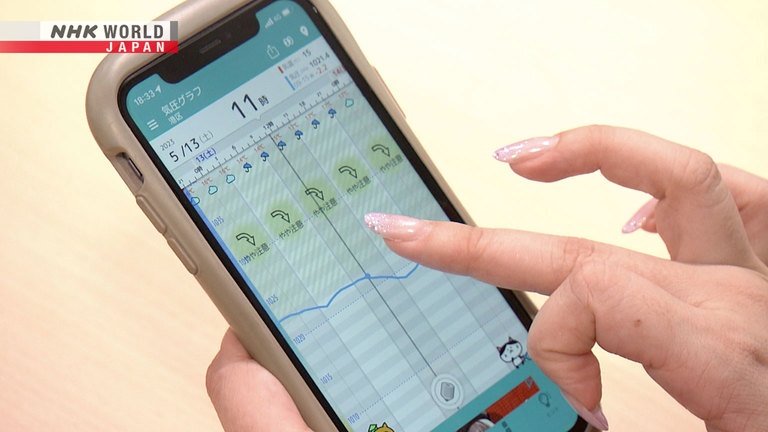
The app displays atmospheric
pressure as a blue line.
Various icons show the likelihood
of different physical effects.
For example, on this day
the blue line slopes gently downward.
Yellow icons are shown as a caution.
On this day,
the drop-off is more dramatic.
Red icons put the user on alert.
Users can record how they feel
by selecting a facial expression.
This data helps them to
understand the conditions
that are more likely
to lead to discomfort.
If you know, for example,
that the pressure will drop tomorrow,
and you're likely to get a headache,
you can try to get
important things finished today.
And when you're feeling bad,
it can be heartening to see that
you're likely to feel better the next day.
The app makes it easier for people
to regulate their emotional state.
Interesting.
I'm sure people all around the world
must have similar symptoms,
and probably have for many, many years,
but nobody thought of
actually trying to
get it into some sort
of understandable form.
Around 200,000 users record
their condition in the app each month.
I contributed to a paper that organized
and analyzed that information.
In February 2023,
that paper was published
by the American Headache Society.
It establishes a clear link
between headaches and the weather.
Extreme weather conditions
have become common in recent years.
Unprecedented torrential downpours
have occurred in many places,
causing significant damage.
Cumulonimbus clouds
can form a “linear rainband”
that produces torrential rain
for hours at a time.
Previously,
this condition could be predicted
with no more than 25 percent accuracy,
half a day in advance.
But now,
the Japan Meteorological Agency
has introduced a supercomputer
that should improve those predictions.
It has twice
the previous computational power,
allowing it to forecast linear rainbands
with much greater accuracy.
Meanwhile, local governments are
appointing certified weather forecasters
who are experts on the local area.
This, too, improves disaster preparedness.
Natsume Yuichi is a weather forecaster
working for the city of Ebina,
in Kanagawa Prefecture.
My main job is in city finances.
But when the forecast shows
that bad weather is on the way,
I'll have a look at the data,
and propose any necessary actions.
Ebina isn't large,
but due to differences in elevation,
the weather in the north of the city
may be significantly different
from the weather in the south.
Accordingly, precise local data is needed.
Natsume refers to weather forecasts
to predict the likelihood
of landslides and flooding.
Based on what he sees,
he can offer the mayor helpful guidance
on a course of action.
During a typhoon in 2019,
a river broke its banks,
causing some of the worst flooding
in the city's history.
Thanks to Natsume's predictions,
5,000 Ebina residents were
evacuated in advance.
As a result, no lives were lost.
I've lived here for 40 years—
ever since I was born.
So for me it's relatively easy to predict
what weather events will happen,
and what disasters might occur.
Having that local knowledge is a big plus.
It's interesting that local governments
would employ meteorologists—
I got it right!
Is that something you think will increase?
Yes, I do.
I think that weather data,
plus other information—
such as topography—
will be used to train AI,
leading to even more accurate forecasting.
However, regardless
of how technology develops,
it will be important for humans
to oversee and manage it.
Right.
That seems to be the case, I think
in most fields,
that AI is really useful,
but you need to pair it
with human intelligence as well.
We heard earlier on how weather data
is helping to reduce food loss,
and also carbon dioxide emissions.
How do you feel about that?
A survey by the Japan
Meteorological Agency
indicated that 60 percent
of Japanese businesses
are aware that they're
affected by the weather.
But only half of them have a strategy
for dealing with it.
And it seems that no more
than 10 percent of businesses
use data in the advanced way
that we recommend.
So there's a lot of companies out there
that know that they need to do something,
but they don't really know what,
and they don't know how
to go about doing it either.
One of the main reasons why
meteorological data isn't more widely used
is that there's still a shortage
of success stories.
That makes it difficult for companies
to justify spending the necessary funds.
That's one aspect.
Another factor is a lack of expertise.
There's an urgent need
to train more people
who can apply data very skillfully
to the business world.
Weather-forecasting uses science
to predict what will happen to us.
I'd say its potential is unlimited.
OK.
Thank you very much.
Thank you very much.