
(Unusual graphical patterns may be difficult to view for some.)
1. The three-day rainfall was the worst in many parts of western Japan since the Meteorological agency began collecting data.
2. Rivers flooded over vast areas.
3. The amount of rain soaking the ground raised the risk of mudslides.
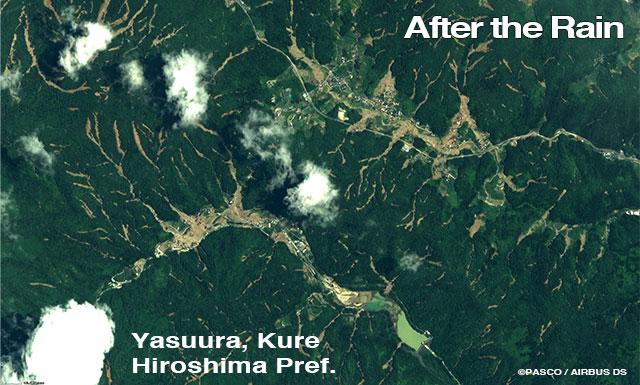
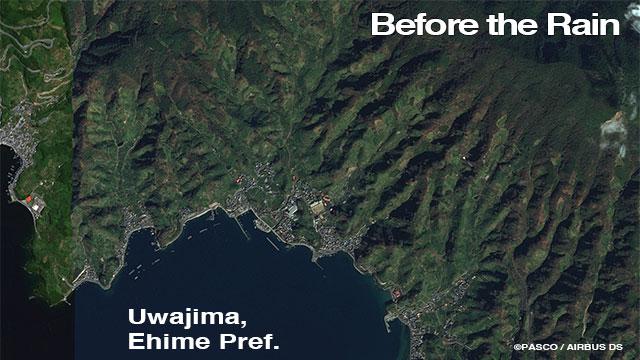
4. There were mudslides everywhere. These satellite images show the areas where mudslides occurred.


5. University of Tokyo Professor Koji Ikeuchi, an expert in water-related emergencies and risk management, explains what conditions resulted in the disaster.
"There are many mountainous areas in Japan, and the topography is steep, so the river beds are also steep. In areas where there are steep slopes, geological conditions are fragile, so flooding and sediment-related disasters can occur shortly after a rainfall, leaving very little time for people to evacuate.
Looking at preventive measures, first, we need to improve the accuracy of predicting concentrated torrential rains. Second, we should increase the number of observation points for monitoring rising rivers. Third, we need to improve our accuracy in predicting rising water levels.
Residents should carefully examine hazard maps showing the areas at risk of flooding and landslides, and they should be aware of these risks near their homes. During periods of heavy rain, people must take the initiative to get information from local authorities and evacuate as soon as possible."